A closer look: examining the macroeconomic and investment landscape
Our Chief Economic Strategist, Gerard Lyons, and our Head of Portfolio Management, Iain Barnes, look at the events that are impacting the global economy and financial markets, and what this means for your investments.
Gerard Lyons
Markets this year have been driven by a combination of factors: health, politics and geopolitics, economic data and policy. Most of the time the focus has been on the economic data and the policy environment (particularly monetary policy), but health and politics have at times dominated the markets. And indeed, both health and politics have the ability to result in extreme outcomes.
For instance, on the geopolitical side there is a worry about Russia on the border of Ukraine and there are ongoing concerns about China and Taiwan, and also Iran – what we might term low probability but high impact events. Health has also naturally become a dominant theme, which we will assess in more detail.
The last year has seen an interesting evolution of all these influences. At the beginning there was very much a focus on health issues, then the sentiment focused on economic recovery. Markets became more optimistic about growth prospects – the rebound from the recession of last year and reflationary policies with monetary and fiscal easing were feeding through.
A focus on inflation followed. We were fortunate to be ahead of the curve in anticipating those inflationary pressures. But the mood then shifted and markets focused on when growth would slow down as inflation pressures fed through and the post-pandemic rebound started to wear off. So at the end of the year markets were confident about growth but worried about inflation pressures in the new year and a growth slowdown, with optimism further tempered by a renewed focus on the Omicron variant.
We can show how things have turned out by illustrating UK data, with other countries mirroring this with a similar profile. In October the UK economy grew by 0.1%, following a rise of 0.6% in September and 0.1% in August. So the economy was still trending higher before this new variant hit.
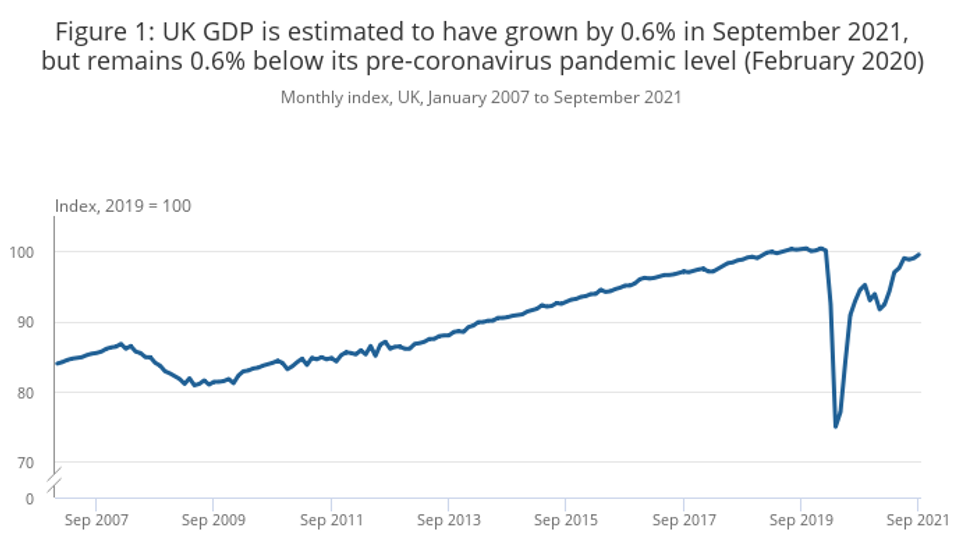
Source: Office for National Statistics.
The profile overall shows how the pandemic has impacted the economy. We fell off the edge of the cliff in the second quarter of last year, hitting bottom in the early summer. The economy then rebounded with the second and third lockdowns causing further disruption amid the recovery.
The economy is still below its pre-pandemic peak of February last year, with it expected to return to that level early in the new year and a continued pickup in activity as we move through the year. While there will be both direct and indirect impacts of the latest covid variant, which are difficult to assess clearly just yet, a key factor is that we must learn to live with this and other variants – an undertaking made easier in the UK with our high degree of protection from vaccinations and boosters.
While the path is still likely to be an upward one, we could see volatility on occasions linked to the latest health issues, both here and across the world. Most growth projections predict fairly strong growth in 2022, before easing to more typical levels in 2023.
Structural drivers
There are some fundamental underlying structural drivers likely to impact the global outlook. We don’t know yet how this pandemic will affect things but as I have said before, the impact will most likely be seen by the three Gs: Grassroots, in that there will be some deglobalisation with some things being done closer to home; a Green agenda, very much already evident pre-pandemic with a heightened focus recently because of COP 26; and Geopolitical issues, particularly the G2 relationship between the US and China.
Yet we should not forget that pre-pandemic factors are likely to dominate. In particular, the shift in the balance of economic power from the west to the Indo Pacific (stretching from India in the west to the US in the east), plus the digital and data revolution. These features cause us to be optimistic about the global outlook and reinforces the need to be broadly diversified in your investment outlook.
Of course, several dynamics and nuances will play an outsized part in the shape and strength of global growth. These are highlighted by the following:
- US jobs data. The US jobs data provides a good overview of the recovery in the US and is a key influence along with inflation on US monetary policy. While the number in work in the US has rebounded significantly, it is still 3.9 million below pre-pandemic figures. But the US economy is recovering and it is well positioned to benefit from the digital and data revolution.
- China’s growth recession. Although China has delivered very impressive growth over the past 25 years and more, the pace of this growth is decelerating and not at a rate to give comfort to policymakers and to continue to generate the jobs they really require. Over the last week there has been a significant shift in policy in China to a focus on stability, which has already promoted an easing in monetary policy and could herald in further stimulus, including in fiscal policy.
- Inflation. The UK situation is a fair reflection of what is also going on in the rest of the world as well, with UK inflation around 4.2%, higher than its 2% target and could go to 7% by next spring. While it is likely to peak there (and abroad inflation should peak in the first half of next year), higher inflation should persist until 2023 and it may not then settle at 1-2%, but maybe at around 3% or so.
- Oil prices. A key factor driving inflationary pressure, oil prices are high, with global demand picking up, but supply is also crucial. While prices have come off their recent peak, they could trend higher as we move through the next 18 months.
The policy backdrop
The policy backdrop has been very significant, not just here in the UK, but globally. We've seen significant fiscal and monetary easing.
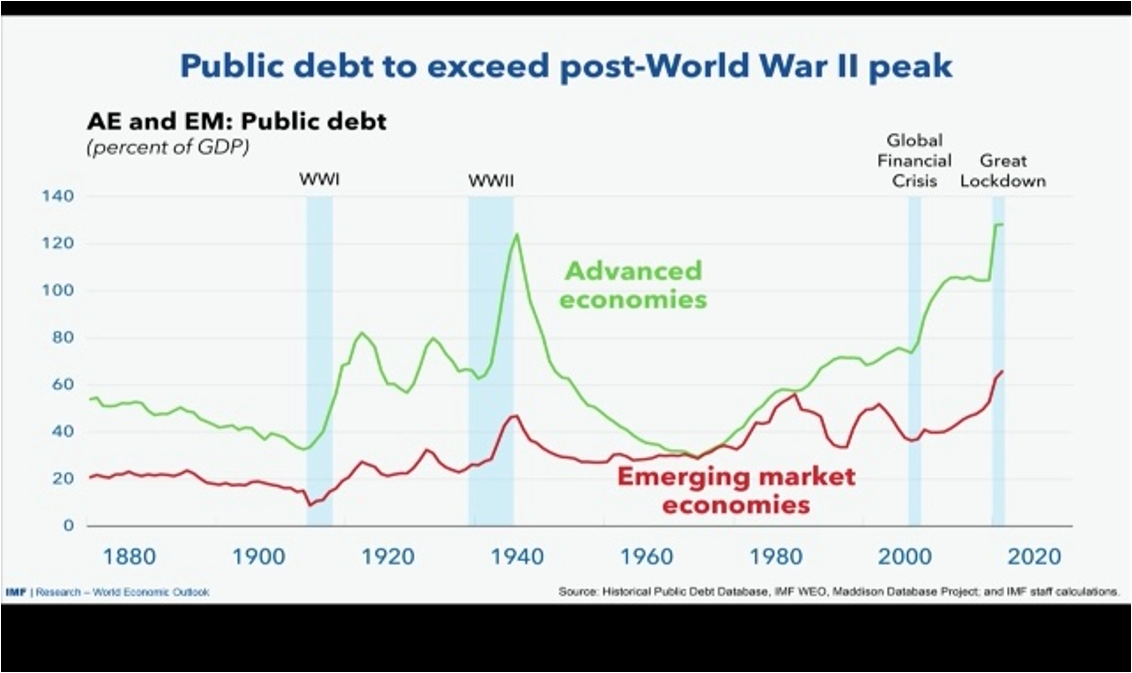
Globally, public debt levels are at an all-time high when you add emerging economies and advanced economies together. This has resulted in significant new government bonds issuance as well, and it poses a challenge as to how different countries escape from this high position of government debt.
But it's also evident here in the UK, where government debt to GDP is just under 100%. As we can see below, it's been higher, around 250% as we emerged from the Second World War, so we shouldn't panic, but naturally, we need to take this seriously.
What are the options? Tax increases, spending cuts, borrowing, or growing the economy? In fact, we've seen a combination of all these influences in terms of the UK, with an emphasis on borrowing and recently, on tax increases.
I think the economy needs lower taxes to help emerge from the pandemic but the best way to reduce the debt to GDP burden is to grow the economy, and to do it steadily over time. It shouldn't be a case of panicking by continuing to raise taxes, or by continuing to curb spending too much – but it highlights the policy and political dilemma.
The markets clearly take note of this, but in particular, the markets are heavily driven by monetary policy, shown in the chart below in terms of policy rates.
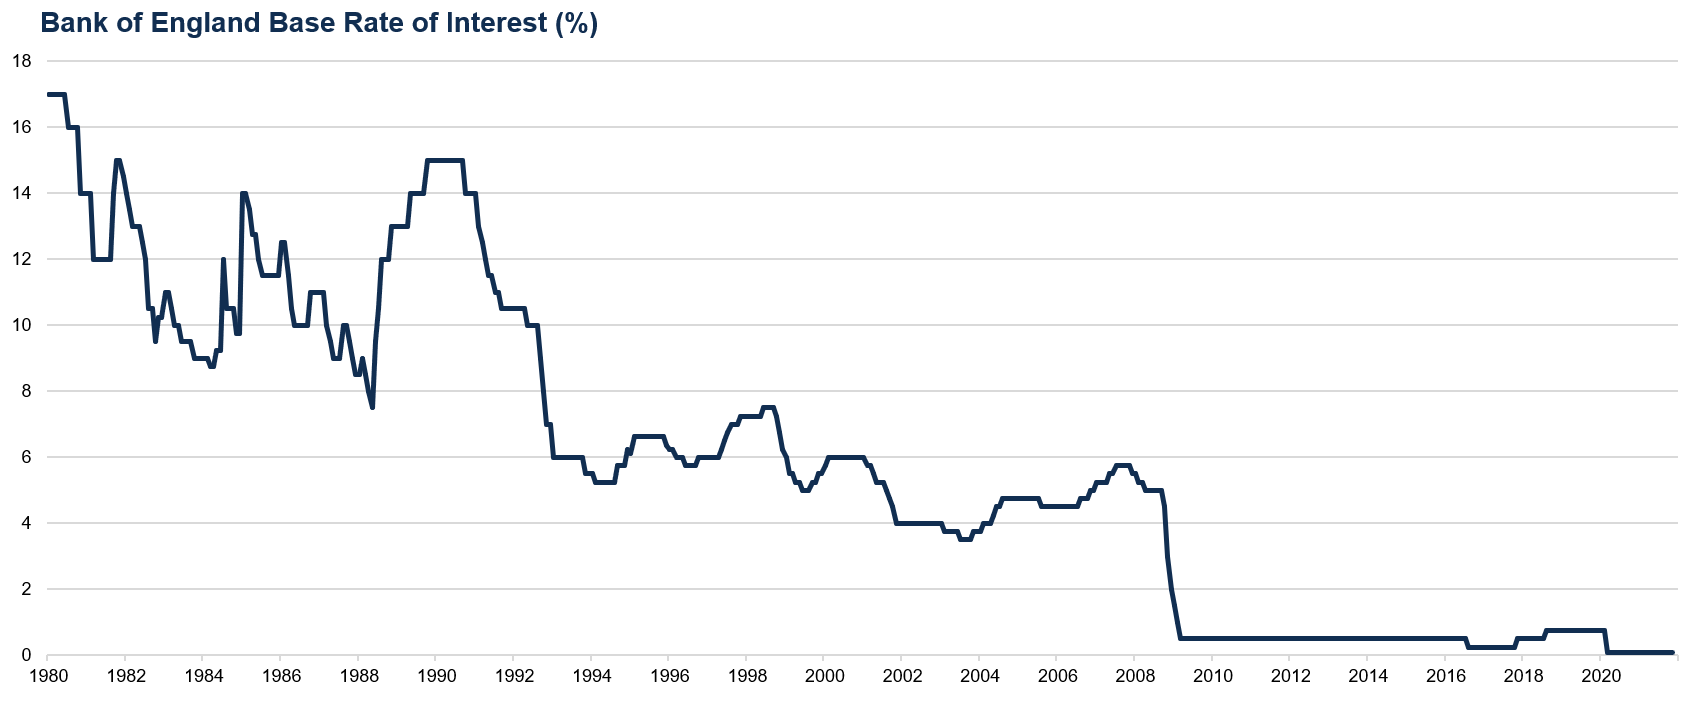
Source: Bloomberg
In my mind, there is no doubt that monetary policy in the UK and in many other countries is far too lax. Monetary policy became the shock absorber in the wake of the 2008 Global Financial Crisis, a crisis from which we've not fully recovered, and then the pandemic struck.
Even ahead of the pandemic, monetary policy was too lax. In the UK since the pandemic, we've seen policy rates lowered to 0.1% and quantitative easing of £895 billion. Quantitative easing should have stopped and been reversed some time ago. The Bank of England did not do that.
The Bank is charged with controlling monetary stability, namely inflation and financial stability. I think they're failing on both measures at the moment. Policy rates are close to zero, meaning that markets are not pricing for risk. Also, at the same time, the Bank's quantitative easing means it has been the biggest buyer of government debt. Longer-term yields are not accordingly reflecting true demand and supply because the biggest buyer has been a non-commercial player.
Therefore, as we look to the next year, it's important from a policy perspective to recognise that policy needs to be tightened and it's important from a market perspective to anticipate policy tightening. It's likely to be gradual and predictable, but it may not be enough, particularly with inflation trending higher and particularly with the need to reverse some of that QE. Yields should continue to reflect the combination of these factors.
Finally, we should mention that sterling is at a very competitive level. It doesn't really reflect political challenges in the UK for international investors, but there is no doubt that UK assets are looking cheap by an international comparison. And that should underpin UK financial markets because sterling's weakness and the undervaluation of UK assets should result in steady inflows into the UK in coming quarters, if not years.
Iain Barnes
As we can see from the chart below, our equity markets allocations in 2021 generally outperformed those in fixed income. Equity markets benefited from the so-called reopening sentiment that rippled across the globe, particularly the US market, but also Europe, including the UK. Asian and emerging market returns were a bit more muted. Returns from bonds were quite low during the year as markets started to worry about the return of inflation. However, commodities have performed extremely well.
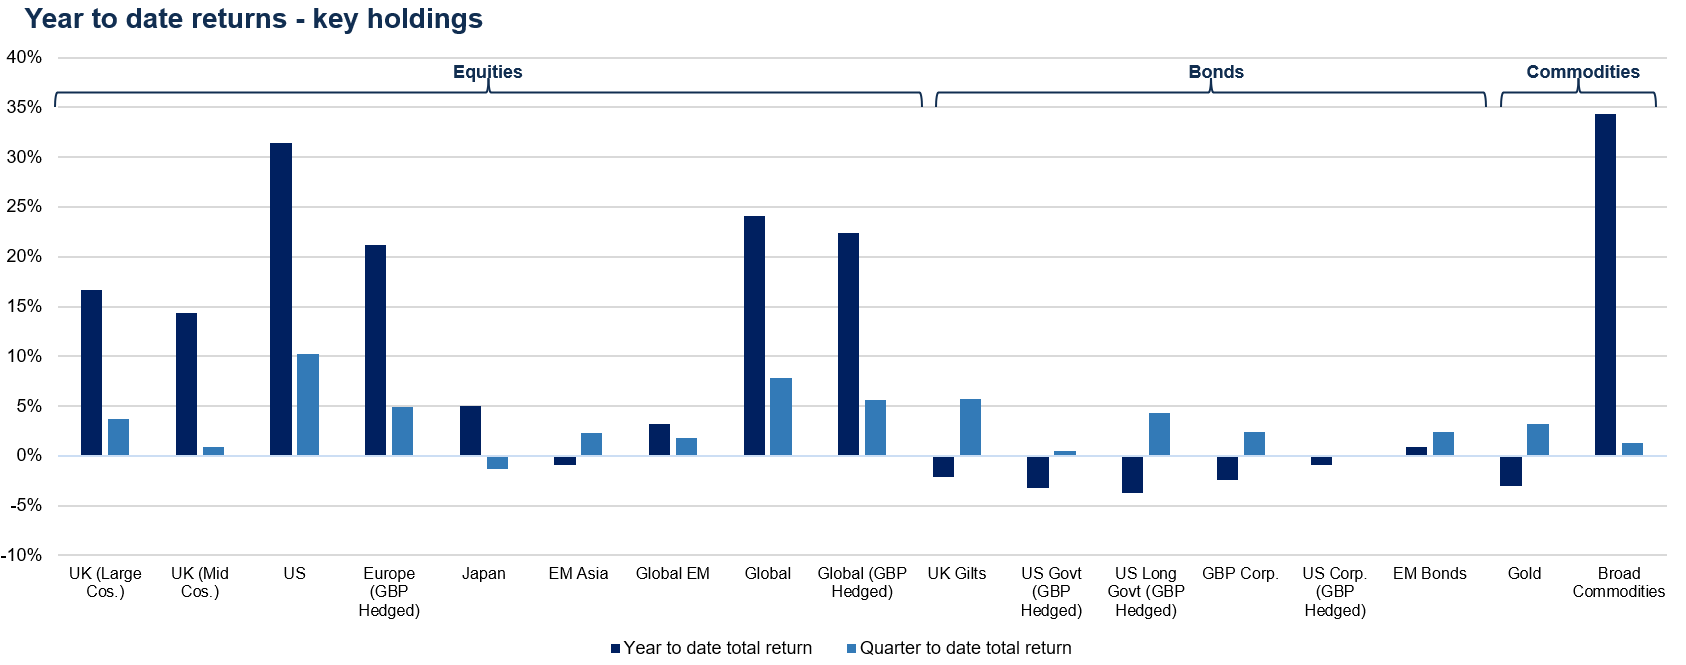
Source: Netwealth. Returns shown to 9 December, in GBP.
Historic performance is not a reliable guide to future performance.
More recently, since September, we have seen more even performance with fixed income picking up, as market sentiment has started to expect that central bank activities will bring some of these inflationary concerns under control. It's worth noting that there have been changes to portfolios throughout the year, but this chart does give you a sense of the broader market environment.
Portfolio performance this year has therefore reflected the advantage that riskier or more growth-oriented assets have enjoyed. As you’d expect, our ambitious portfolios have outstripped more cautious portfolios, which have a higher allocation to more defensive assets. At the higher end of the spectrum those ambitious portfolios have delivered above what our expectations for what an average annual performance would be. We can see the range of returns across our seven risk portfolios in the chart below.
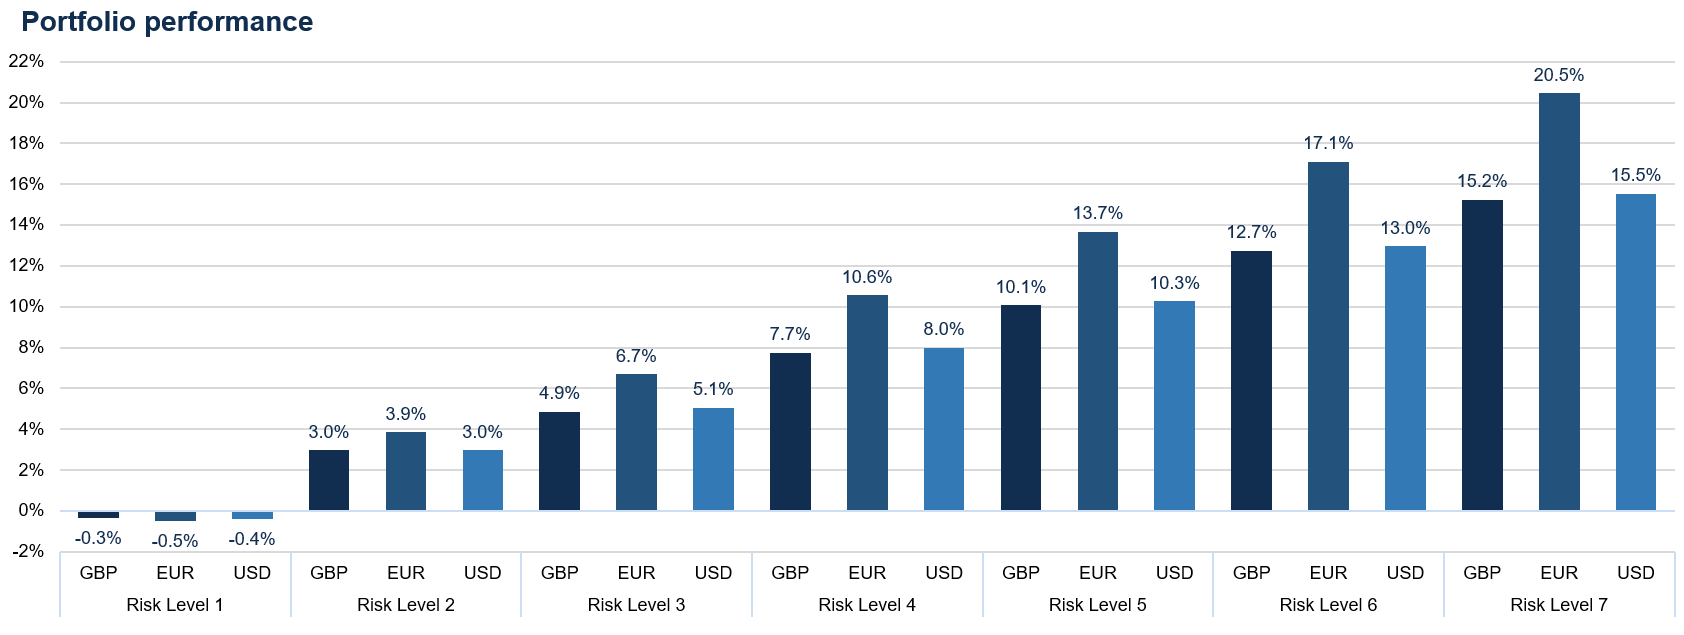
Source: Netwealth. Returns shown net of all fees to 8 December 2021. Returns shown are of indicative live portfolios in each Risk Level, using the market prices at which purchases and sales took place. Returns are shown net of (i) all charges associated with the underlying fund investments and (ii) a Netwealth fee of 0.35% per annum covering management, trading, custody and administration charges. Netwealth’s fees range from 0.65% – 0.35% pa depending on account size.
These figures refer to the past, and past performance is not a reliable indicator of future results.
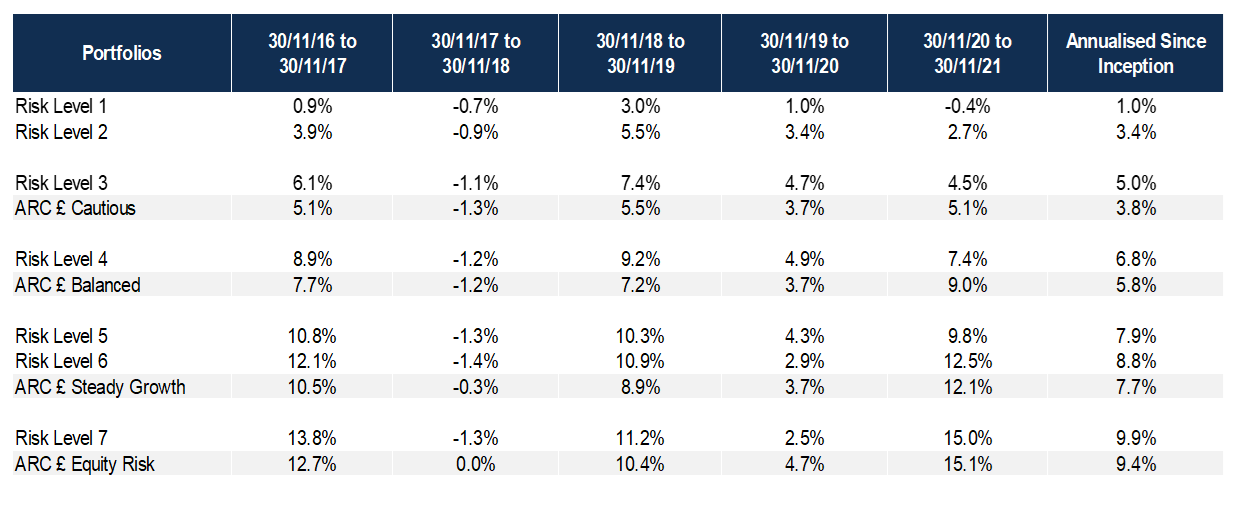
Source: Bloomberg, Asset Risk Consultants & Netwealth Investments. Returns shown net of all fees to 30th November 2021. ARC data contains estimates for peer groups for October and November 2021. Returns shown are of indicative live portfolios in each Risk Level, using the market prices at which purchases and sales took place. Returns are shown net of (i) all charges associated with the underlying fund investments and (ii) a Netwealth fee of 0.35% per annum covering management, trading, custody and administration charges. Netwealth fees range from 0.65% - 0.35% pa depending on account size. The data shown is from inception in May 2016 and as such there is no data available for prior periods.
These figures refer to the past, and past performance is not a reliable indicator of future results.
A closer look at bond yields
The level of yields in the US Treasury market now is low compared to history. And the long-term trend is very clear. The prevailing yield available on these high-quality US Government bonds has come down from high single digits in 1988 to very low levels in recent years, which you can see at the bottom right-hand corner of the chart below.
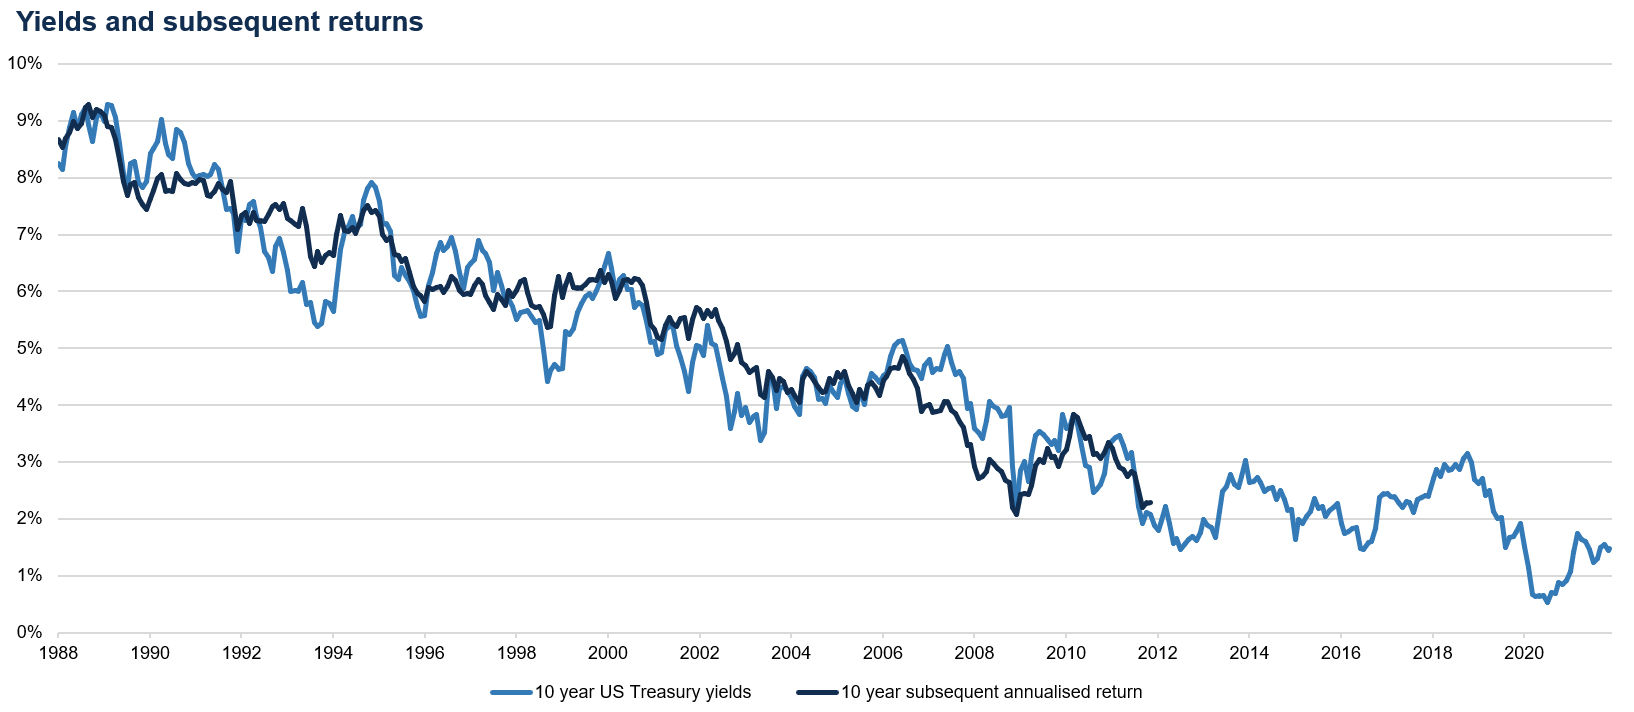
Source: Bloomberg, with Netwealth calculations.
We have overlaid the subsequent returns that these assets have generated in the 10 years after each yield data point is considered. That's the dark blue line, and you can see that the prevailing level of yield is really the most important driver of future returns. What that means as we look to the right is that you should really be expecting quite muted levels of returns from the safest government bonds out there.
That's a really important challenge facing markets as a key point is that this doesn't reflect inflationary pressures. When you take into account the current inflationary spike, the question of how long and how intense that inflationary pressure will be is really important as to how people value these instruments.
So the real yield (the yield after inflation) is at the lowest level that investors have experienced, which on a standalone basis is not attractive. We still believe that bonds have a role to play within portfolios – in periods of volatility, people still like to own safe assets. But you should expect more muted levels of return, particularly risk adjusted returns from these investments.
This scenario highlights the importance of being more selective in the type of bonds that we own in portfolios. We've changed our fixed income exposure quite a bit this year and that trend will continue, as we try to identify the best places to retain that level of safety within portfolios, but that can contribute meaningfully to portfolio returns as well.
The US continues to power ahead
A key driver of equity returns in the past couple of years has been the US market. On the right-hand side of the chart below, you can see the index return in both 2020 and 2021 to date, which show returns around the 20% mark.
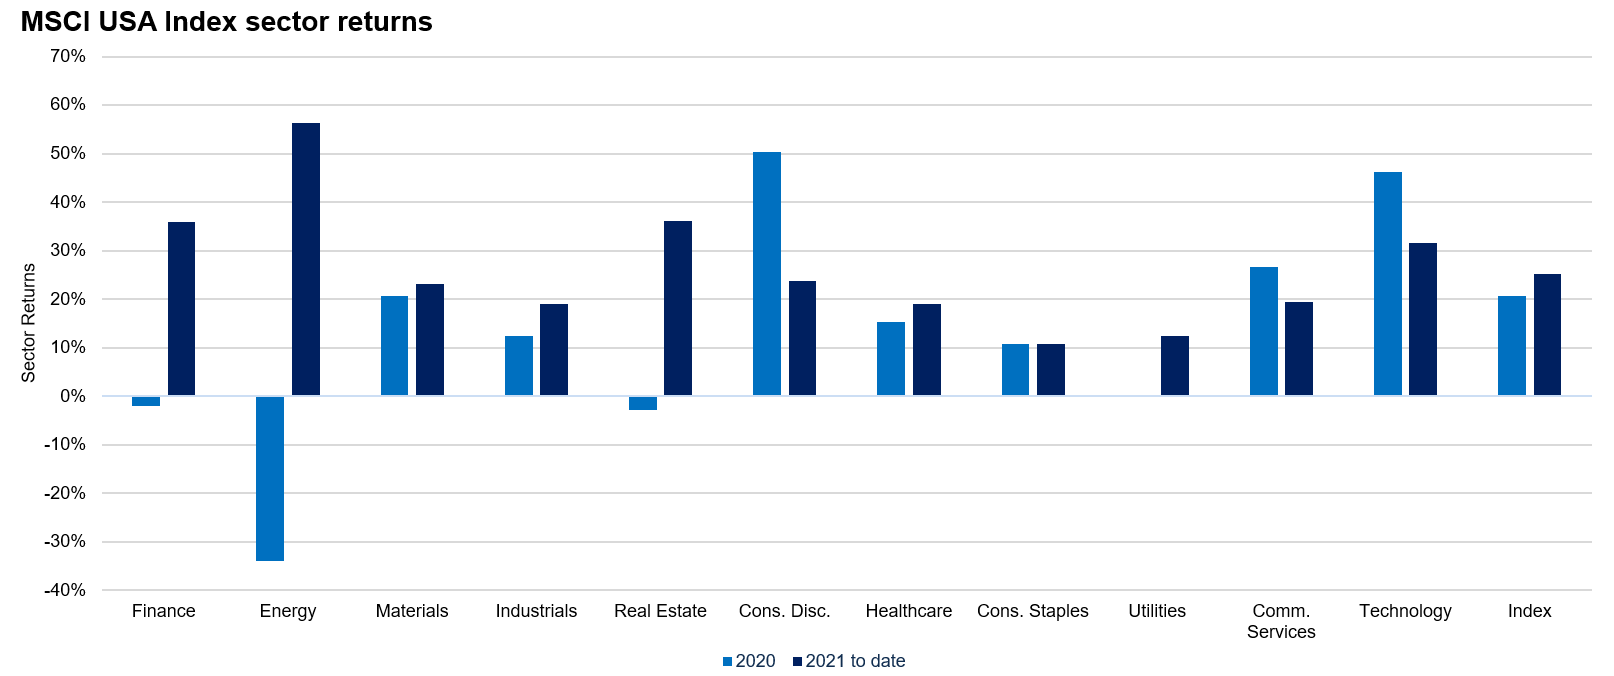
Source: Bloomberg, with Netwealth calculations. Returns shown to 9 December, in USD.
Historic performance is not a reliable guide to future performance.
Clearly, those returns have not been consistent in all the different sectors we show on this chart. The performance of companies in the energy sector, for example, and other areas which were damaged by lockdowns and different governmental measures in 2020, were strongly negatively impacted.
We have witnessed a bounce back this year in those sectors that are most exposed to global growth. Across the board, US companies have consistently done a very good job with the support of government and central banks in sustaining their levels of profits.
Earnings per share growth has been quite strong so these returns have been justified to an extent. The consensus is estimating about 50% earnings per share growth across the US market this year, but there are also expectations of 7.5% to 10% growth in each of the next two years as well.
However, what we're starting to be concerned about is that this level of earnings or profitability strength is developing into strong stock price momentum. That is clearly beneficial for performance, but as always, it's not clear when the market will change its mind on the outlook for future sustained earnings growth.
So we still like the US, and we have a cyclical position to have a larger portfolio allocation in the US than is normally the case. But in the back of our minds, we're very aware that the market can change its mind on the outlook for these companies, and that's where we come back to the significance of diversification.
Why being diversified matters
All equity markets tend to be influenced by similar factors and indeed by the performance of each other; on any given day when one leading market goes up, it's likely that others will follow suit. But that's not necessarily the case over the longer term, and it's very difficult to predict if and when the market will change its mind on the future prospects of companies that are represented in different markets.
What we do know, however, is that markets tend to work in cycles.
Over the past 20 years, for example, the returns generated by US equities and emerging market equities have been pretty similar. Both markets have returned about 9.5% to 10% per annum. But the path of those returns has been very different.
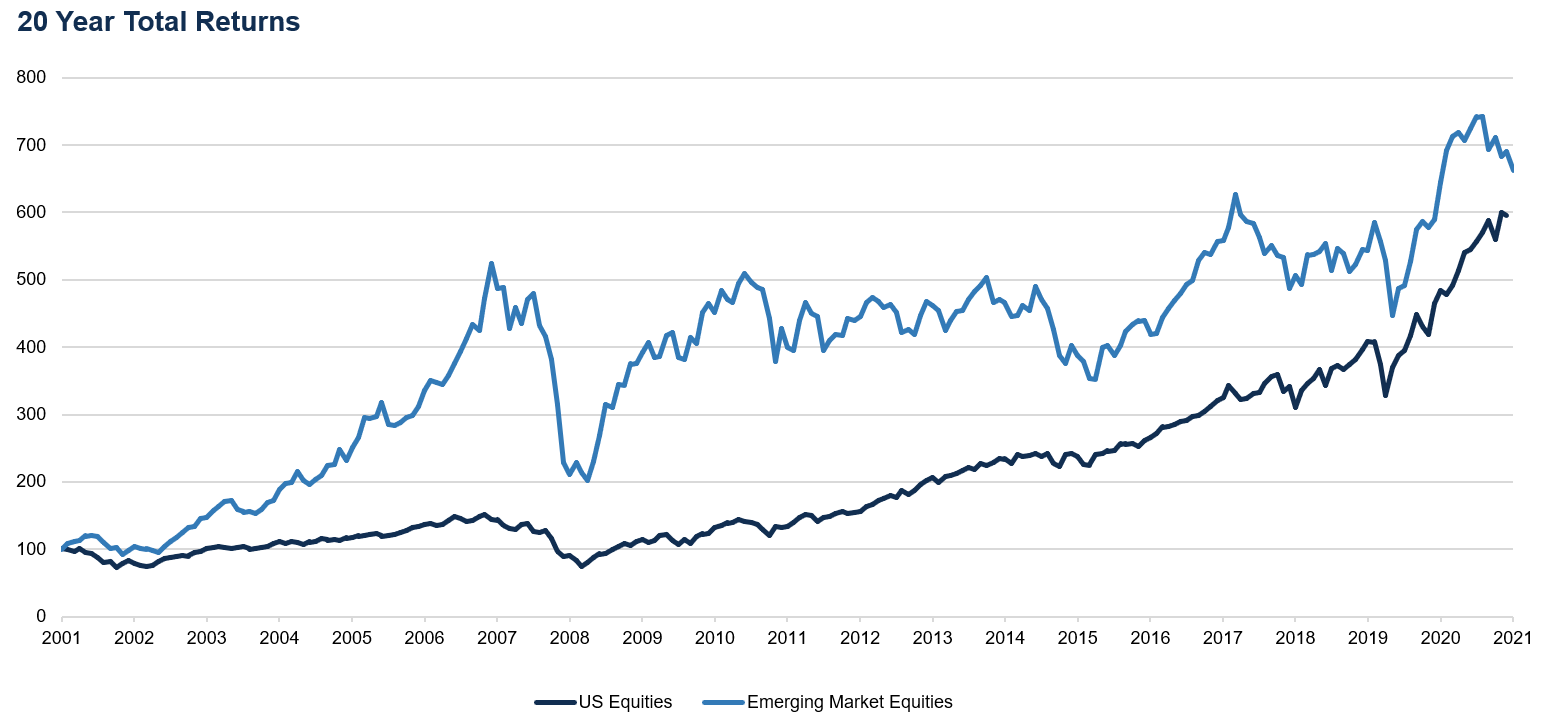
Source: Bloomberg, with Netwealth calculations. Returns shown to 9 December, in USD.
Historic performance is not a reliable guide to future performance.
In the first 10 years emerging markets had really strong growth in economic terms, and also in the share price performance of China and other emerging markets. Yet the next decade illustrated a very different story. The US, which spent the first 10 years of this century struggling to make ground in relative terms, has been delivering very strong share price performance since the Global Financial Crisis.
What investors need to remember is that things can change dramatically. The macro environment within many emerging markets has been a key component. A narrowing growth premium to developed markets and the devaluation of a range of emerging market currencies has had a big impact over the past 10 years.
While the US has been performing strongly, it is important to maintain different drivers of risk, so that if the broader environment changes, then portfolios still have some exposure to assets that will do well in different scenarios. There are still headwinds for areas like emerging markets, as in other parts of the world, but it is crucial to think about the better valuations that have built some protection against disappointment in these markets.
The forward-looking price-to-earnings ratio in China, and the rest of emerging markets, is about 12.2 times. That's about half the valuation that’s baked into US markets now. So if and when there is a change in environment, portfolios need to be prepared for it. The overall characteristics of what's working well in portfolios could change.
That's what we will focus on in the year ahead – making sure that our portfolios are exposed to a range of different drivers and assets that can benefit from a changing world.
Please note, the value of your investments can go down as well as up.