First Quarter Investment Review 2022
Russia’s invasion of Ukraine overshadowed all other issues during the quarter. Indicators of market volatility, which were already elevated, snapped higher as investors assessed the tragic humanitarian consequences as well as the wider economic implications for the European and global political order.
Financial markets had already been under pressure as economic growth was slowing from the strong levels seen in 2021, and inflation was remaining stubbornly high. The invasion reinforced these pre-existing trends, driving sharp increases in the price levels of commodities such as oil, natural gas and wheat.
In February, the annual rate of change of the UK Consumer Price Index hit a 29-year high of 6.2%, as an example. The impact of the war has been most concentrated on those countries close geographically and economically to Russia and Ukraine, particularly those who import a high proportion of their energy.
Energy costs continued their sharp increases in the first quarter
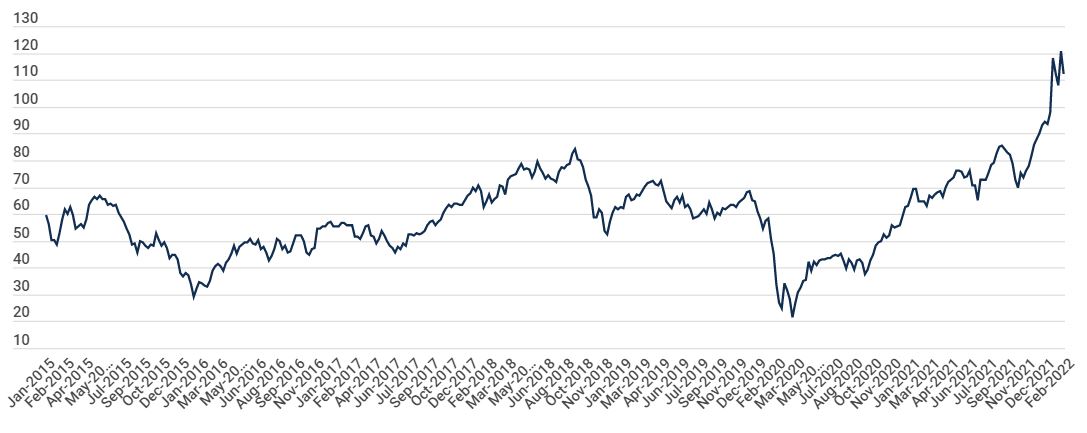
Source: Bloomberg. Oil Price (Brent 1st Futures Contract, $).
During the quarter, central bankers trying to head off inflationary risks took a more aggressive stance than previously anticipated by markets. The Bank of England increased interest rates twice to reach the pre-pandemic level of 0.75%, accompanied by the Federal Reserve in the US, who also signalled that a series of further hikes should be expected.
Perhaps the biggest change in tone came from the European Central Bank who suggested their longstanding negative interest rate policy may be coming to an end during 2022. The US dollar strengthened notably against other major currencies, and government bond markets performed poorly, despite the significant political uncertainty which usually offers this asset class support. Broad US Treasury indices delivered their weakest calendar quarter in more than 50 years.
Bonds with shorter maturities provided the worst outcome in relative terms, suggesting that the markets think that these higher interest rates will ultimately stifle global growth. Equity markets also saw some significant moves. The UK’s FTSE 100 Index performed relatively well, delivering a modest positive return thanks to its significant exposure to energy companies.
Despite early volatility, US equities outperformed other regions in common currency terms on the expectation that corporate profits would prove more resilient than elsewhere, supported by the prospects of better growth. Emerging markets captured a wide range of country returns. Regulatory uncertainty around Chinese technology stocks and the conflict-hit Eastern European constituents detracted from performance.
Portfolio activity and outlook
High inflationary pressure and the outlook for prices remains key for all asset classes. Inflation could act as a brake on future economic activity as well as calling into question how valuable future cashflows from various assets will prove. The evolving reaction function of policymakers to the various drivers of this inflationary episode should be closely monitored.
Where relevant, portfolios increased their positions in larger UK and US companies during the quarter, and reduced the allocations to European and smaller UK companies. In addition, sterling portfolios partially unhedged the currency exposure of their European equity holdings.
How various assets performed in the first quarter of 2022
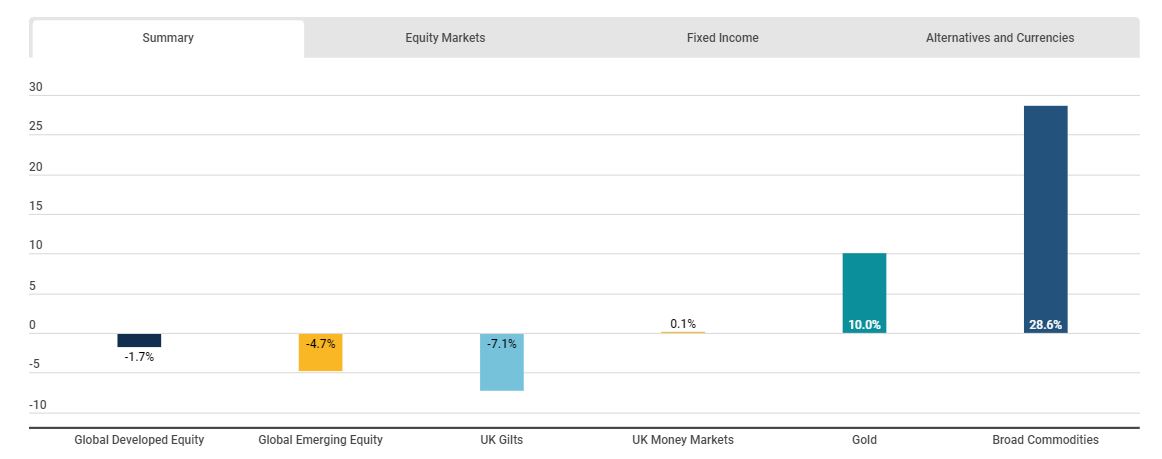
Source: Bloomberg. All returns are in GBP unless otherwise stated.
Netwealth portfolio performance
Portfolios faced a challenging start to the year, falling under the pressure first of rising prices and central bank activity, then from uncertainty from the Russian invasion of Ukraine. Strong performance in the final two weeks softened the damage.
Larger Cap domestic equities provided the most resilient performance. US equities outperformed other regions, supported by an appreciating US dollar. European equities were the weakest performers, reflecting perceived risk from the conflict.
Fixed income assets were unable to offer protection with both government and corporate bonds falling in value under pressure from rising interest rates. Our targeted exposure to long-dated US government bonds and very short-dated corporates performed better than broader allocations. Gold rose sharply in response to geo-political and inflation concerns.
Netwealth first quarter 2022 returns
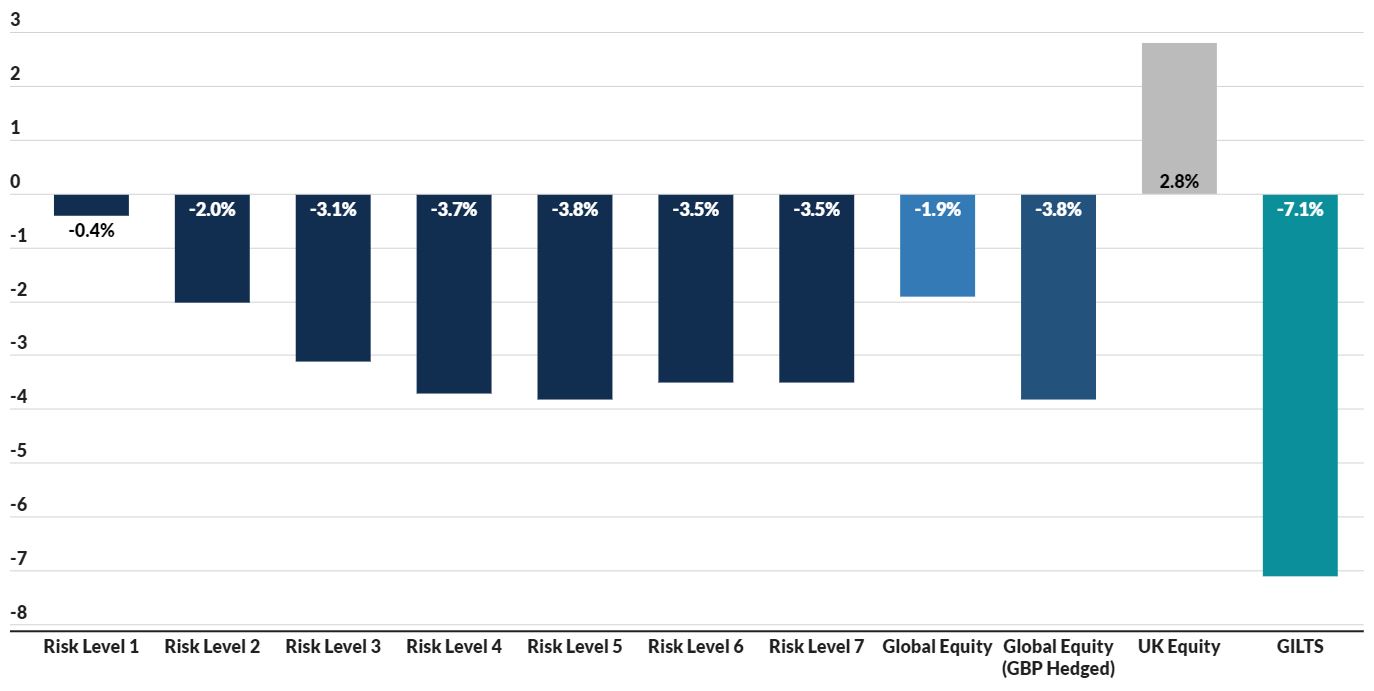
Source: Bloomberg & Netwealth Investments.
Returns are of indicative live portfolios and are shown net of (i) all charges associated with the underlying investments and (ii) a Netwealth management fee of 0.35% per annum. The data shown is from inception in May 2016.
These figures refer to the past, and past performance is not a reliable indicator of future results.
Putting this performance into long-term context
While falling markets can be unnerving (although this is to be expected from time to time), it is worth looking at our long-term performance to provide essential context – and to show that even in the face of considerable market turmoil, like the pandemic, markets do tend to recover over time.
Below we show the performance of our seven risk portfolios, then our relative performance compared to a relevant peer benchmark (Asset Risk Consultants), and below that a breakdown of our 12-month returns over the past five years.
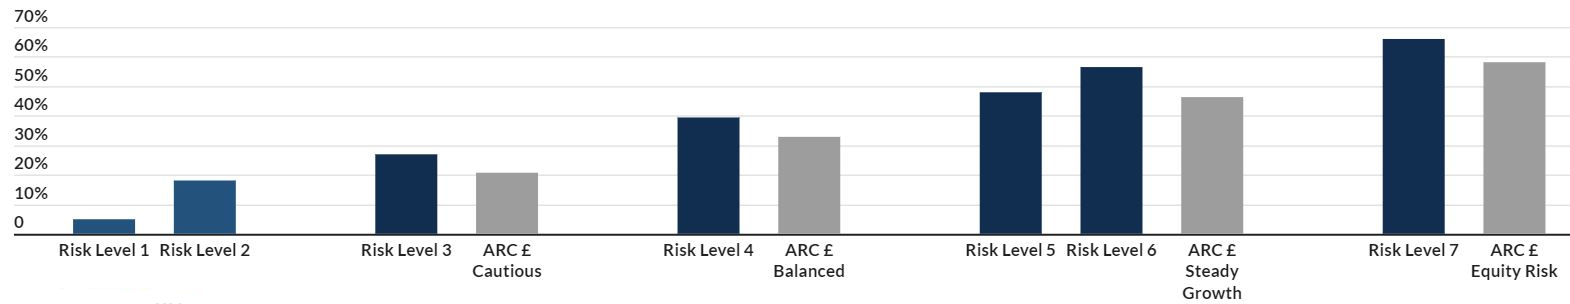
Netwealth GBP portfolios performance since inception (until 31st March 2022)
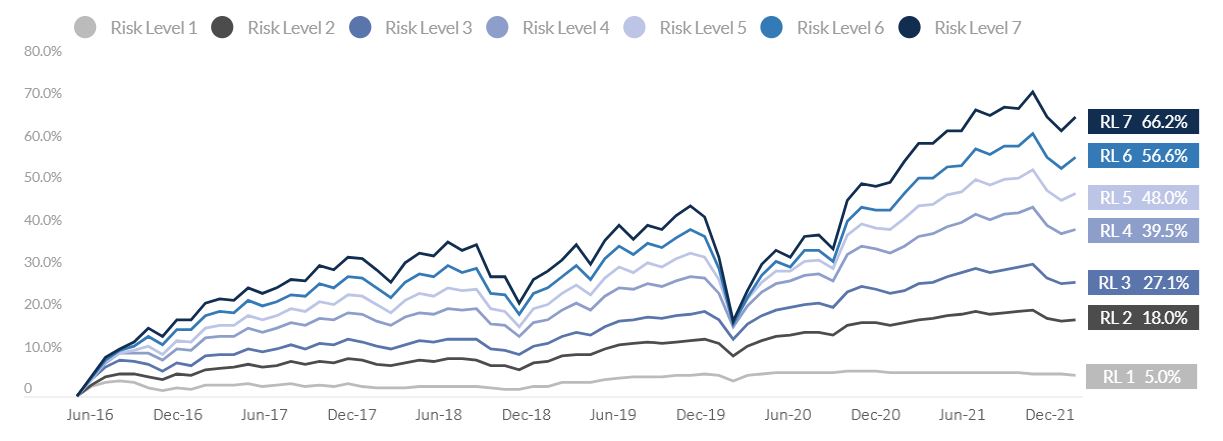
Source: Bloomberg, Asset Risk Consultants & Netwealth Investments.
Returns are of indicative live portfolios and are shown net of (i) all charges associated with the underlying investments and (ii) a Netwealth management fee of 0.35% per annum. The data shown is from inception in May 2016. ARC data contains estimates for January and February & March 2022.
These figures refer to the past, and past performance is not a reliable indicator of future results.
Relative returns (as at 31st March 2022)
12 month returns (as at 31st March 2022)
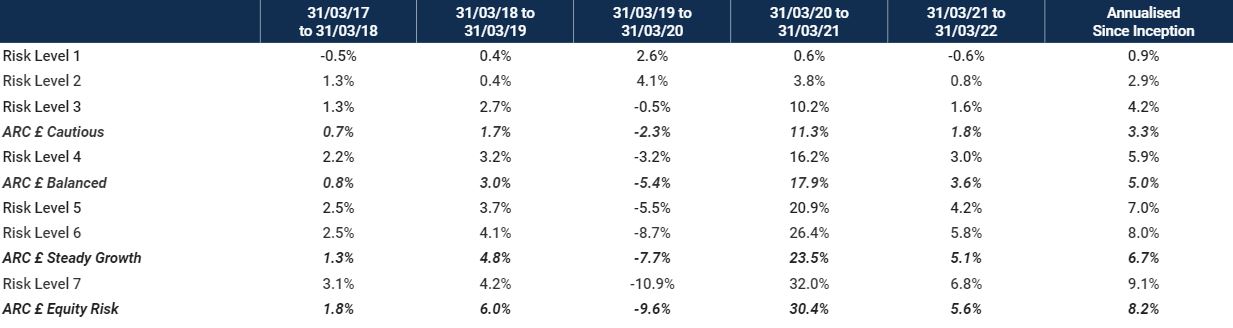
Source: Bloomberg, Asset Risk Consultants & Netwealth Investments.
Returns are of indicative live portfolios and are shown net of (i) all charges associated with the underlying investments and (ii) a Netwealth management fee of 0.35% per annum. The data shown is from inception in May 2016. ARC data contains estimates for January and February & March 2022.
These figures refer to the past, and past performance is not a reliable indicator of future results.
If you would like to know more about how a globally diversified and actively managed asset allocation could help you achieve your investment goals, please get in touch.
Please note, the value of your investments can go down as well as up.