Active vs Passive Investing —What You Need to Know
The objective of any investment manager is to generate strong returns relative to the level of risk they are taking within the portfolio. Investors should understand how these returns can be generated, how consistent they might be, and how much it costs to invest.
Defining return is relatively straightforward with most managers looking to generate either:
- Absolute returns – positive returns over every period; or
- Relative returns – positive returns relative to a market index. For example, the FTSE 100, a peer group of other managers such as the ARC index of UK wealth managers or an economic index such as CPI inflation.
Risk is a little harder to define and can mean different things to different investors. However, it is generally measured by the level of volatility in portfolio values or the size of portfolio peak to trough falls when markets have dropped.
Other objectives, such as a target level of income, and restrictions (for example, socially responsible investing principles) may be overlayed to the risk and return targets to define the overall investment mandate.
Investment processes
Once an investment manager knows the level of return or risk that is being targeted and the overall investment mandate, they can then try and optimise their investment process to achieve the most return for the given level of risk, or vice versa, to define the minimum risk required for a given return target.
Managers pursue numerous different investment approaches, however, most wealth management firms follow a process that involves some elements of the following:
Strategic asset allocations – choosing the starting point for allocations (the percentage of money invested) to different asset classes such as fixed income, equities and currencies.
Tactical asset allocations – shorter-term adjustments to portfolio allocations to either take advantage of a perceived return opportunity or protect against a potential risk.
Instrument selection – choosing which funds, stocks or bonds to hold in the portfolio to achieve the desired strategic and tactical allocations. For example, to benefit from the potential of the UK stock market a manager could buy an active fund, a passive (tracking) exchange traded fund (ETF) or individual company shares.
Active and passive investment approaches
How managers decide to populate their portfolios and the emphasis they place on each of the areas mentioned above will define their investment approach. Irrespective of the exact investment process, managers will likely either follow a passive, active or combined approach to investing.
Passive investment – making investments in line with a chosen benchmark index. Generally, very few adjustments are made to the portfolio’s allocations with the aim being to track the benchmark index as efficiently and cheaply as possible.
Active investment – making investments with the objective of generating better returns or lower risk than a benchmark index. This will mean holding significantly different investments, when compared to the benchmark, and/or changing these positions regularly.
Some managers will combine elements of active investment with passive. For example, actively changing the amounts allocated to different asset classes, such as US equities and government bonds, while investing in those allocations through passive funds or ETFs.
In theory, an active investment approach has the potential to outperform a passive approach which seeks to, at best, track the chosen benchmark. If an active manager is skilled at timing when to make changes or deciding which investments to buy relative to the benchmark, they have the potential to outperform.
Costs and fees
As active management relies upon manager skill and effort, this approach attracts a higher level of fees to reward the managers for their time. Additional transaction costs are also often associated with active management approaches, as these strategies can require more frequent trading.
Passive investment approaches normally focus on delivering investment returns for the lowest level of fees or costs and, as there is infrequent trading, there will also be less additional cost.
At the individual fund level, the ongoing charges figures (OCFs) for active funds often range from 0.5% to 1.5% per annum. This compares to passive funds that can have OCFs as low as 0.05% and will often range from 0.05% to 0.5%.
When considering a multi-asset portfolio provided by a wealth manager, you should typically factor in certain additional costs. These can include the wealth manager’s fees, safe custody of the assets and administration.
This means that all-in wealth management portfolio fees for active investment approaches tend to range from 1.25% to 2.5% per annum, while passive approaches will likely range from 0.5% to 1.25% depending on the individual manager and the portfolio size.
Active vs passive performance
Numerous studies (which we highlight in this article) have shown that on average, active managers do not consistently outperform their chosen benchmarks. While the distribution of performance is relatively centred around the benchmark index return, the cost of managing active investments shift the distribution of returns below the benchmark.
This outcome is illustrated below with this graphic taken from a Financial Conduct Authority (FCA) report on the asset management industry.
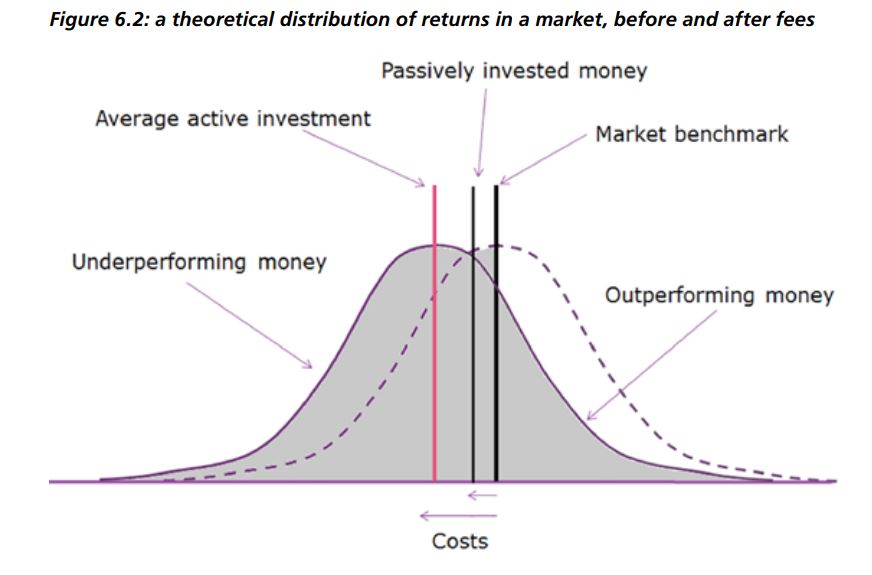
Source: Financial Conduct Authority.
Data to the end of July 2022 confirms this picture. The chart below shows the relative performance of ETFs compared to active peer groups, and the outcome over various timeframes is quite revealing.
Relative performance – ETFs vs active peer groups
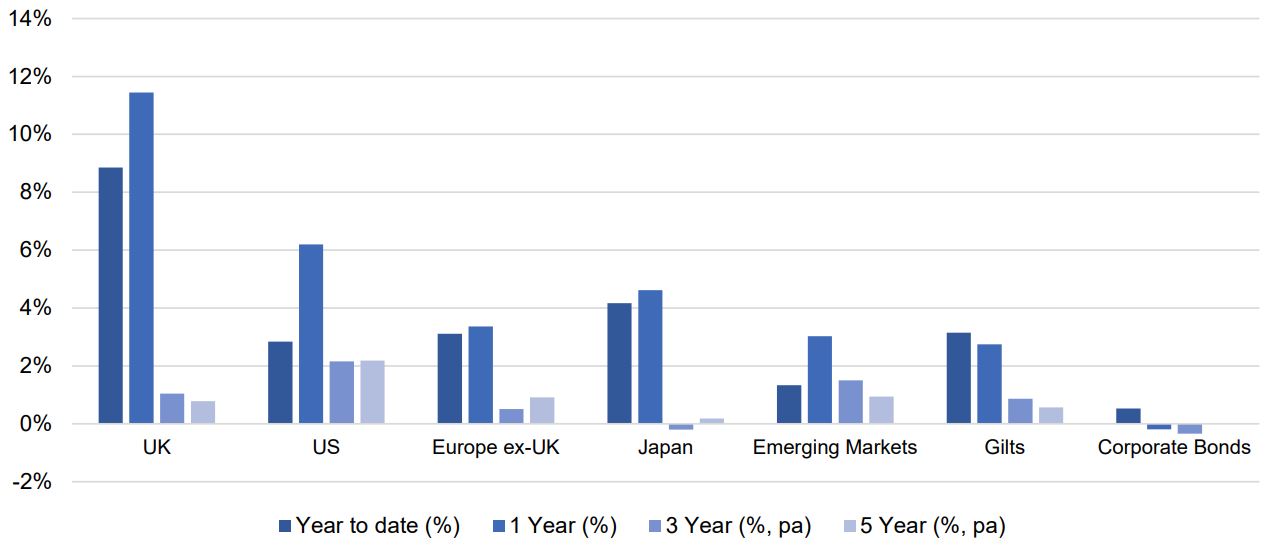
Source: Bloomberg, Morningstar. Data to 29/7/22
In almost all cases the peer group of active managers has underperformed the passive fund/ETF. However, there will always be managers that outperform passive funds and their benchmarks over a given time period – the difficulty is in choosing managers that will outperform in the future and do so consistently.
Picking enduring winners is hard
While the success of managers as a whole can fluctuate over any given period (largely as a result of how different “style” factors have performed), the biggest challenge is that it tends not to be the same fund managers that perform year in, year out. So the percentage of managers who can outperform on a consistent basis becomes very small. Moreover, picking funds based on strong historic performance has not been a successful strategy in delivering strong future performance.
This can be seen in recent analysis from Standard & Poor’s (S&P). The S&P SPIVA database shows that active funds in all asset classes struggle to produce enduring performance after fees. For example, in the universe of US equity managers, focusing on larger capitalisation stocks, 32.15% outperformed the S&P 500 over the three years to the end of 2021. However, when analysing a 10-year period this number dropped to only 16.9% of funds.
Style biases are often the real reason for managers’ relative performance
Over some specific periods, active funds have beaten standard benchmark indices on average. However, evidence suggests that these episodes are often the result of popular style biases being (temporarily) rewarded. For example, the universe of UK equity managers generally has a bias towards investing in small or medium-sized companies, where one imagines that the fund manager expects to add more value through their stock-picking skill.
What this means is that active UK equity funds outperform their benchmarks whenever the “midcaps” are beating larger companies, and vice versa.
The implication is clear: if active funds are only beating their benchmarks because of an innate bias to a particular style or factor exposure, and investors have no reason to believe that this style will be repeated in the future, then there is no reason to believe that managers will continue to beat their benchmarks in the future.
Furthermore, given the growth of cost-efficient strategies designed to give specific exposure to different styles such as small-caps, value, growth, quality etc, if investors really want to target these styles, then there are more effective, transparent ways of doing so without paying up for active managers.
Many managers are not genuinely active
There are several reasons why supposedly active fund managers do not end up being as active as their clients hope or believe. The result, however, is that they do not give themselves the opportunity to generate enough outperformance to clear their (high) fee rates. Some studies have placed the blame on so-called “short-termism” of fund managers’ clients and shareholders.
Others cite the “career risk” that faces a fund manager who has underperformed for a prolonged period – it’s better to play it safe than “shoot for the stars”. Behavioural characteristics such as loss aversion may also be a factor. The net result is that there are a host of managers who charge “active” fees while hugging their benchmarks – baking a given level of after-fee underperformance into the cake.
The FCA found that 42% of all active funds had delivered returns with a tracking error (or deviation from their chosen benchmark) of less than 1.5%, and 15% of active funds delivered less than 1.1%. As per the table below, many of these funds still carried Ongoing Charges Figures (OCF) of 1% or more – with the result being that £35bn of investors’ assets was in funds with a minimal chance of outperforming their selected benchmarks.
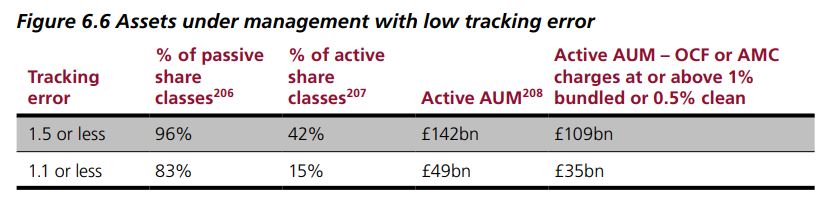
Source: Financial Conduct Authority.
Netwealth’s investment approach – active asset allocation and passive implementation
The evidence is overwhelming that active funds generally struggle to outperform their benchmark after fees over time. While there are managers that will outperform, we know it is very difficult to consistently identify them before they do. As a result, we focus on investing through passive funds and ETFs, a process we describe in detail here.
This helps us to keep the total costs of investing low for our clients, which ultimately has helped to generate better net returns. However, we do believe that compared to a completely passive approach there are some areas in which active intervention can add value.
Firstly, the setting of strategic allocations. These decisions about how much to invest in specific asset classes, such as equities and bonds, will have the biggest impact on a portfolio’s risk and return characteristics. We actively decide what the appropriate allocations should be, rather than relying on the weights defined by a market capitalisation index such as the MSCI World Index.
This allows us to incorporate characteristics in portfolios we believe are beneficial, such as defensive currency allocations that aim to reduce the level of peak to trough falls during times of market stress.
Secondly, while strategic allocations should provide the best long-term mix of assets to generate positive returns for a given level of risk, it may be beneficial to adjust these allocations over a shorter timeframe. In particular, we focus on mitigating specific risks embedded in the strategic allocations.
We are therefore not making changes to try and target short-term extra return opportunities; instead, we are focused on making fairly modest adjustments actively, to target potential areas of risk. We call these adjustments cyclical positions which are both actively implemented and monitored to make sure they are adding value and scaled appropriately.

The result of our investment approach: consistent outperformance
Netwealth performance as at 31 August 2022 – since inception (May 2016) relative to peers
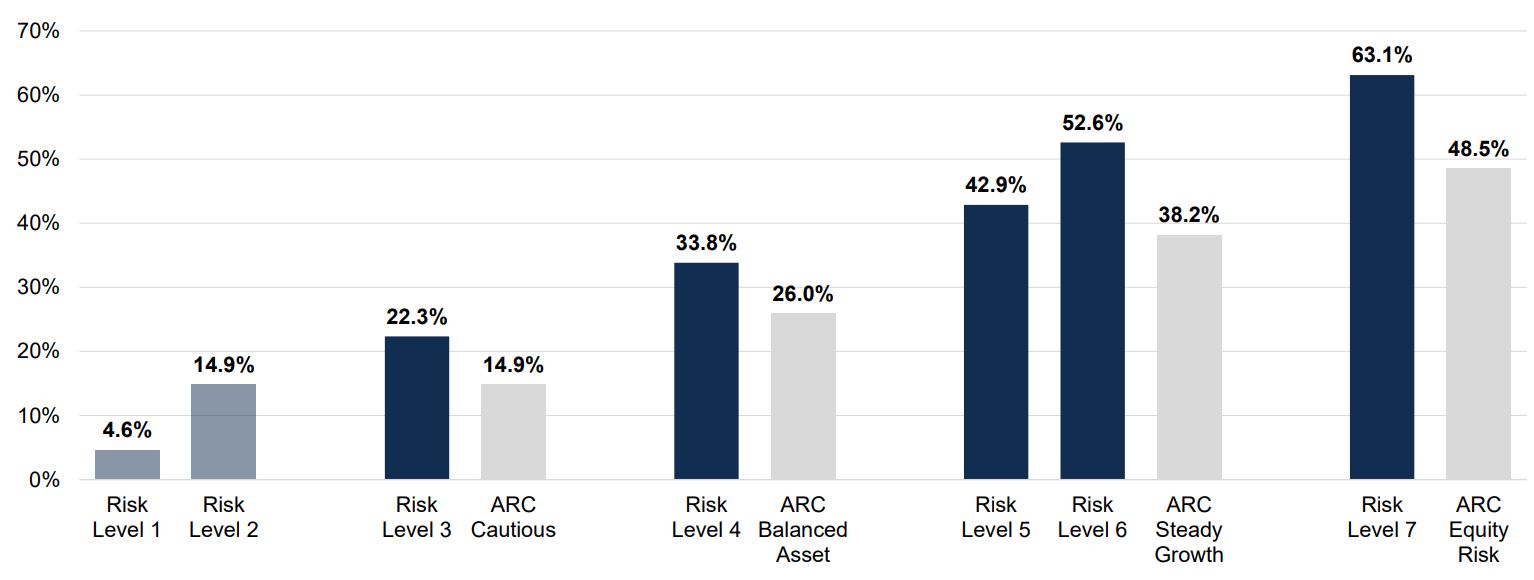
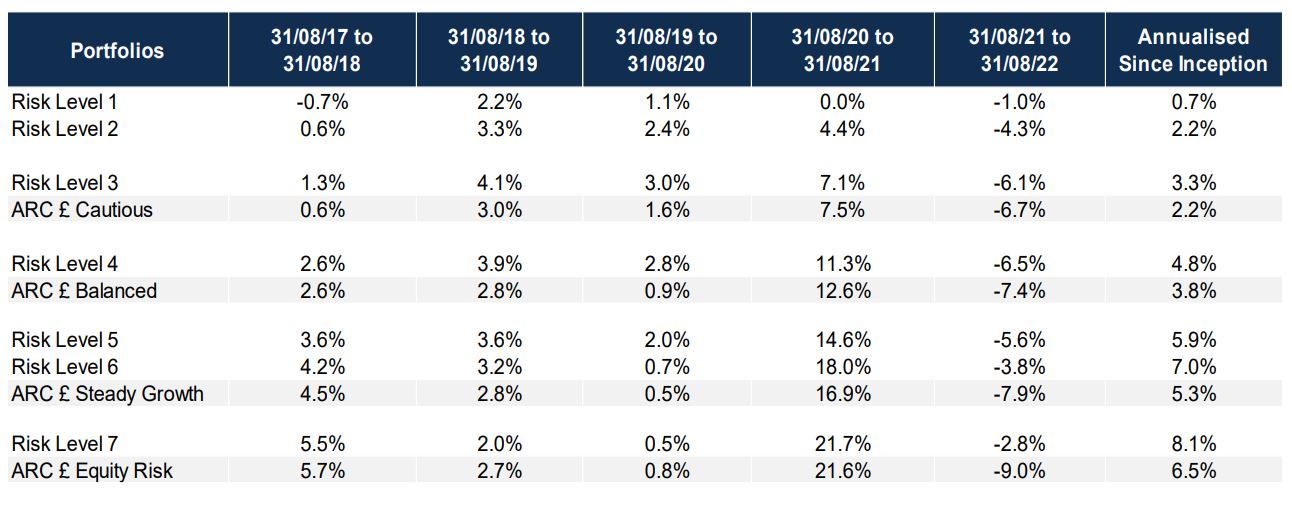
These figures refer to the past, and past performance is not a reliable indicator of future results.
Source: Bloomberg, Asset Risk Consultants & Netwealth. Returns shown net of all fees to 31st August 2022. ARC data contains estimates for peer groups for July and August 2022.
Returns shown are of indicative live portfolios in each Risk Level, using the market prices at which purchases and sales took place. Returns are shown net of (i) all charges associated with the underlying fund investments and (ii) a Netwealth fee of 0.35% per annum covering management, trading, custody and administration charges. Netwealth fees range from 0.65% - 0.35% pa depending on account size. The data shown is from inception in May 2016 and as such there is no data available for prior periods.
In summary
Choosing an active or passive wealth manager – or one who expertly combines the two – is up to each individual investor. But you should be aware of the long-term impact of the financial choices you make.
You may, for example, be drawn to the allure of potentially higher returns from an active manager, yet you should also realise how consistently their performance objectives can realistically be attained – and at what cost.
Please get in touch, with no obligation, about how we can help you achieve your goals.
Please note, the value of your investments can go down as well as up.