
Asset Class Returns Against a Difficult Market
The defining aspect of the market environment has been the move away from zero or even negative interest rates set as part of Covid responses from leading central banks. This reversal and then march higher was itself a reaction to the strong inflationary impulse that developed from 2021, as seen below.
Central Bank Interest Rates 2018-2023
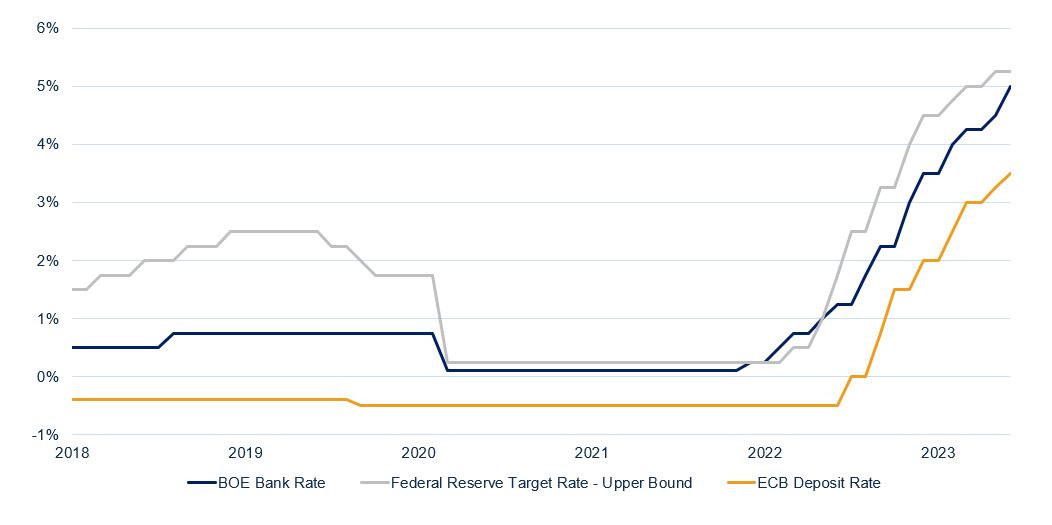
Source: Bloomberg
The transition from cheap money to a more normal interest rate environment has had a marked impact on the returns of different investment markets: the cost of borrowing triggered a re-pricing across asset classes. Perhaps the clearest example of the volatility created has been in the highest quality asset class of all – the US government bond market, known as Treasuries.
Low starting yields heading into this inflationary episode led to slightly negative returns in 2021. This, in itself, was unsurprising. As we have articulated before, low prevailing yields imply low long-term returns. However, the magnitude of underperformance in 2022 was unprecedented, as shown in the chart below. Rising inflationary pressure was boosted by supply challenges, commodity strength and the sense that central bankers were too slow to respond.
Thankfully, for holders of US Treasury bonds the first half of 2023 has been a more stable environment. Returns are tracking to a more normal outcome compared to the challenges of the previous two years, attributed to the higher levels of prevailing yields now available and the prospect of (at worst) a less aggressive future path of interest rate increases around the world. At best, signs of subsiding domestic inflationary pressure during June suggests that the Federal Reserve’s hiking cycle might already be over.
Returns of the US Treasury Bond Market by Year, 1993 to 2023 to date
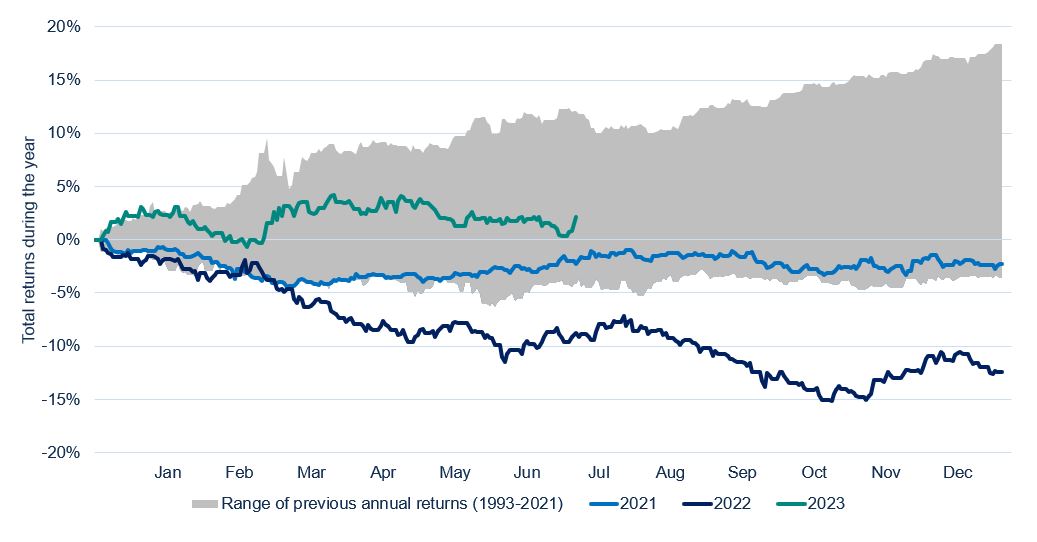
Source: Bloomberg with Netwealth calculations. Returns shown of the Bloomberg US Treasury Total Return Index in US dollars. 2023 data reflects returns up to July 13th.
This changing dynamic was also reflected in the performance of other parts of the fixed income universe. The chart below shows the returns of various instruments which have been held on Netwealth portfolios, depending on the Risk Level. Blue bars show government bonds, green are high quality corporate bonds, while orange denote the traditionally riskier parts of the issuer universe who are more likely to default or be downgraded. The lighter shades are the weak returns seen in 2022, while the bolder colours represent the better conditions of 2023 to date.
Return Comparison for Fixed Income ETFs in 2022 and 2023
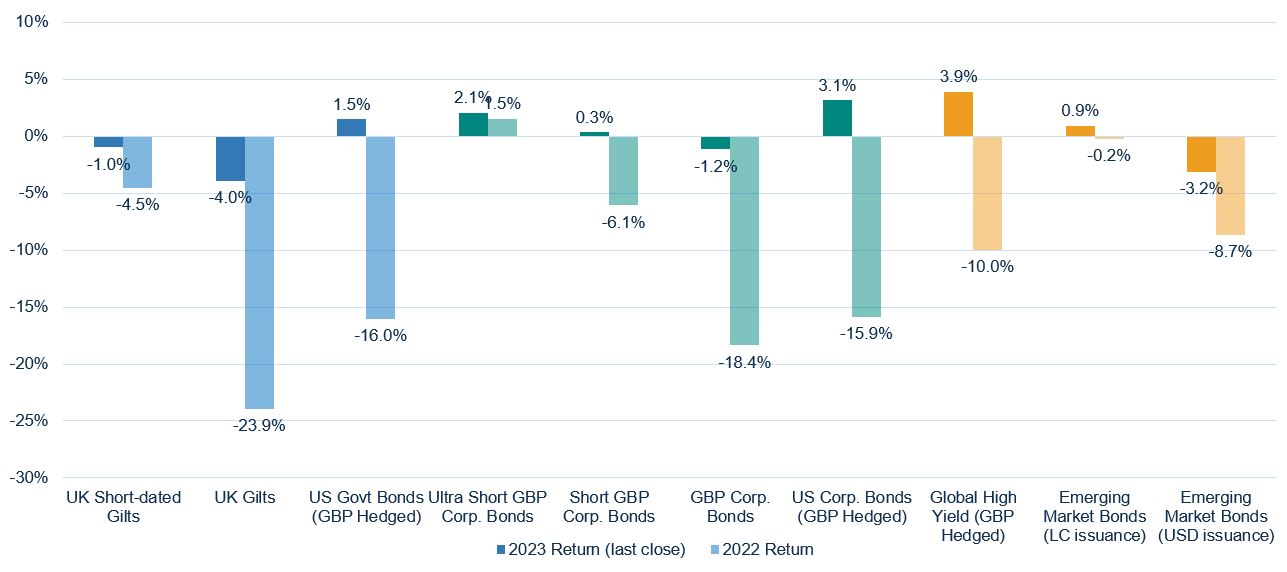
Source: Bloomberg with Netwealth calculations. Returns shown in GBP terms. 2023 data reflects returns up to July 13th.
Two things stand out. Firstly, assets which are either short-dated or ‘riskier’ broadly performed better than the perceived higher quality, but longer maturity bonds. This is because long-dated, higher quality assets tend to have greater price sensitivity to movements in the yield curve, a characteristic known as duration. As rates forced curves higher, these bonds underperformed. Secondly, while international assets have made progress in 2023, UK bonds are still under pressure as domestic inflation has been more challenging, and the market expectation is for still higher rates.
During this period, equity investors have also seen periods of volatility. Economic growth has often appeared precarious, with an expected negative impact for corporate profits. 2022 calendar year returns were largely negative as investors considered the impact of higher borrowing costs on growth, creating a difficult period for multi asset investors who saw both equities and bonds underperform. Exchange traded funds (ETFs) tracking global developed and emerging markets returned -8.6% and -10.6% in sterling terms respectively.
Helpfully for Netwealth strategies, large companies in the UK were the best performers, returning +4.9%, on account of their significant allocations to energy and materials sectors. 2023 has seen a partial reflection of this outcome, with the US market leading developed markets higher, again, thanks to the technology sector’s return to favour, while UK large companies struggled in the face of falling prices of natural resources.
It is clear, however, from the below chart that there is still a lack of conviction in the prospects for parts of the global economy. Emerging markets, in particular China, and the domestic exposure of UK small companies have continued to struggle over this two-year period. Retaining any strong view on the timing and likelihood of these more cyclical markets to rebound has been risky; and many managers have found the returns of global indices very difficult to match as a result of such large regional and sectoral performance dispersion.
Return Comparison for Key Equity ETFs June 2021-2023
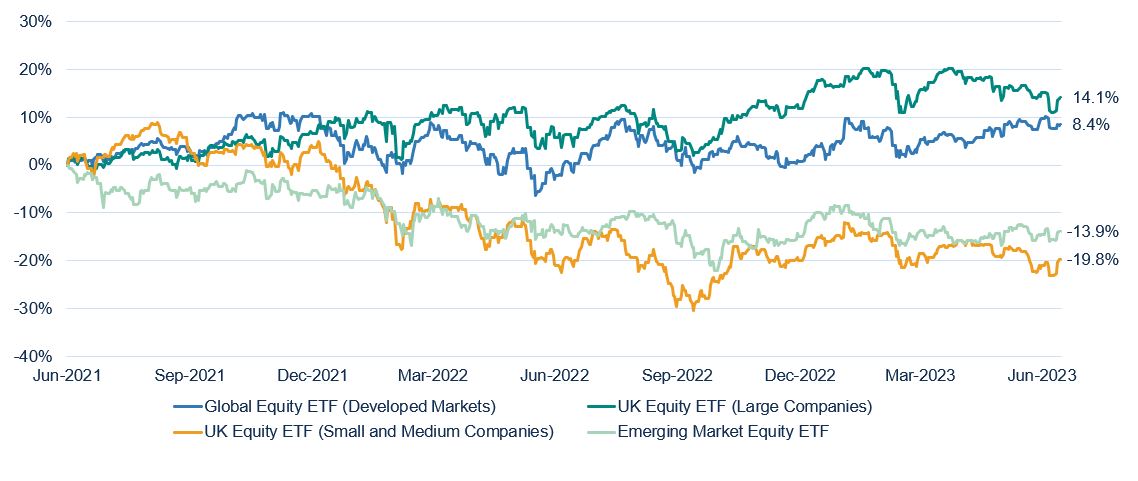
Source: Bloomberg with Netwealth calculations. Returns shown in GBP terms from 30th June 2021 to 30th June 2023
Portfolio Performance
We are pleased with the returns that client portfolios have seen since launch in 2016, as we discussed most recently here. The returns over the past two years, however, have been disappointing in absolute terms. We took several measures (discussed below) which helped to dampen the impact from periods of volatility – but this has not been sufficient to offset fully some of the negative market trends.
In particular, clients who invested in our more cautious portfolios (Risk Levels 2-3) have seen returns towards the bottom of their expected performance ranges, on account of the impact of bond allocations. When we look at the realised total returns of the past two years compared to the historic returns our strategic allocations would have delivered in the past 25 years, we can see the impact this environment has had; the shortfall compared to average returns is marked.
In higher risk portfolios (Risk Levels 6-7), the returns have been below average, but far from the negative or positive extremes. For these strategies, with their diversified exposure to international equity markets, returns tend to be most volatile when entering / recovering periods of significant financial dislocation and corporate earnings recessions.
Analysis of GBP Risk Level Portfolio Range: Two Year Returns in Context
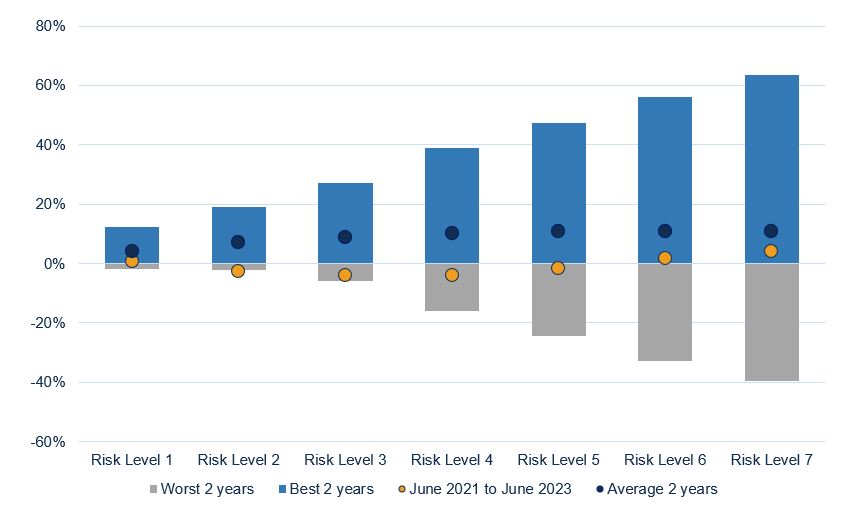
These figures refer to the past, and past performance is not a reliable indicator of future results.
Source: Netwealth calculations, using a combination of historic two-year market returns of current strategic allocations between 1998 and 2022, and live client portfolio returns. Performance shown net of fees.
It is important to note that these difficult conditions are not unique to the Netwealth portfolios; other multi-asset strategies have also found this period challenging. When we consider the returns of the peer group of wealth managers compiled by Asset Risk Consultants (ARC), we see that the Netwealth portfolios compare favourably. This is also true when we look across to multi-asset funds offered to DIY investors on investment platforms. Despite our preference for predominantly passive implementation due to the greater cost efficiency it provides, relative performance has been strong against a volatile backdrop.
For the cautious portfolios, positive relative performance has been incremental. It is clearest in the higher risk categories such as Risk Level 6 and 7, where the management of regional and currency allocations combined with a focus on good liquidity across market risks has been rewarded. Undoubtedly, the focus on maintaining a low-cost profile across the portfolio range has been a major tailwind against challenging markets.
Netwealth GBP Risk Level Portfolio Performance vs ARC peer groups.
Two-year performance June 30th 2021 to June 30th 2023
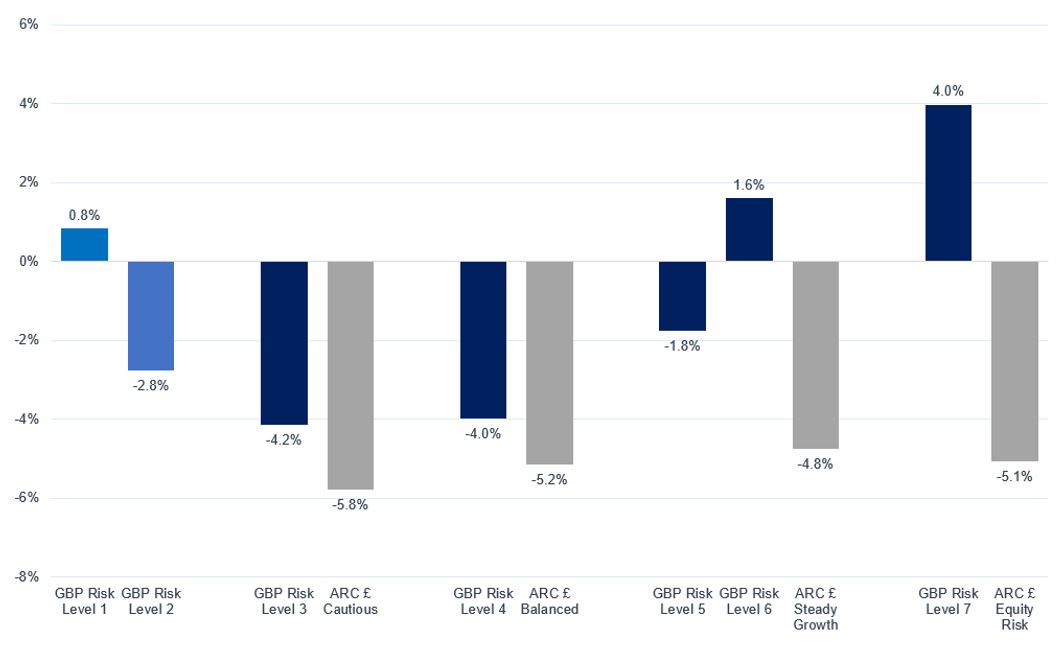
These figures refer to the past, and past performance is not a reliable indicator of future results.
Source: Asset Risk Consultants (ARC), Netwealth.
These returns compound the strong relative performance built up through time, as shown in the below tables.
GBP Performance – Overview as at 30th June 2023
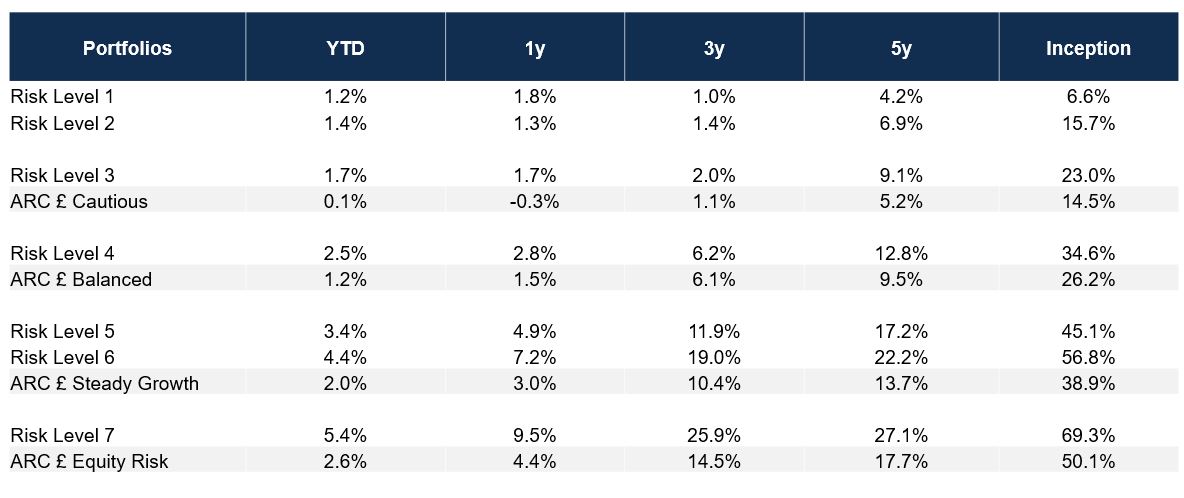
These figures refer to the past, and past performance is not a reliable indicator of future results.
Source: Bloomberg, Asset Risk Consultants & Netwealth. Returns shown net of all fees to 30th June 2023. ARC data contains estimates for peer groups for April, May and June 2023.
Returns are of indicative live portfolios and are shown net of (i) all charges associated with the underlying investments and (ii) a Netwealth management fee of 0.35% per annum covering management, trading, custody and administration up to 30/04/2023 and 0.40% from 01/05/2023. Netwealth fees range from 0.70% - 0.40% pa depending on account size. The data shown is from inception in May 2016 and as such there is no data available for prior periods.
GBP Performance – Overview as at 30th June 2023
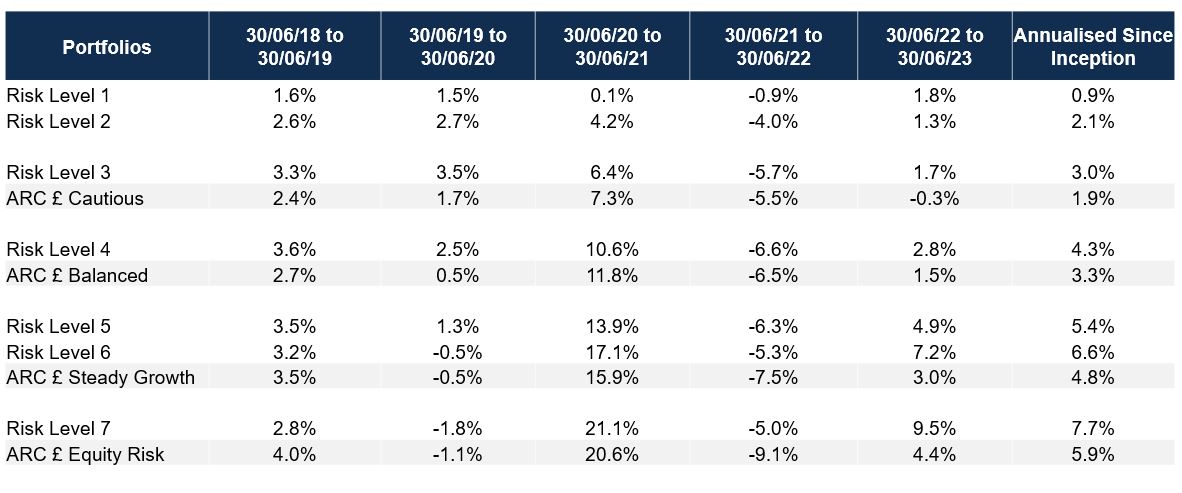
These figures refer to the past, and past performance is not a reliable indicator of future results.
Source: Bloomberg, Asset Risk Consultants & Netwealth. Returns shown net of all fees to 30th June 2023. ARC data contains estimates for peer groups for April, May and June 2023.
Returns are of indicative live portfolios and are shown net of (i) all charges associated with the underlying investments and (ii) a Netwealth management fee of 0.35% per annum covering management, trading, custody and administration up to 30/04/2023 and 0.40% from 01/05/2023. Netwealth fees range from 0.70% - 0.40% pa depending on account size. The data shown is from inception in May 2016 and as such there is no data available for prior periods.
A full analysis of Netwealth performance is available here.
How have we managed portfolios in this period, and how are they positioned?
An important part of our investment approach is the review of portfolios’ strategic allocations to reflect changes in market conditions, with a particular eye on valuations. Early in 2021 as part of our strategic review, we reduced ‘core’ government and high quality corporate bond duration on portfolios, on account of their low yields. We preferred instead to allocate more exposure to targeted parts of the bond market as well as introducing other diversifying assets, such as gold.
While our investment approach is to manage allocations thoughtfully and actively, we are unlikely to shift completely away from such an important strategic anchor on portfolios as bond markets. Instead, we chose to invest less in the parts of the market worst affected by conditions, effectively smoothing overall portfolio returns as a result.
Incremental cyclical exposure (where assets are affected by changes to the wider economy) to broader commodities on the expectation of persistent inflationary pressure has also served to offset the shift to higher yields. The later additions of local currency denominated emerging market bonds and high yield corporate bonds have also benefited returns across the portfolio range. We have resisted the opportunity to date of investing in assets with weak liquidity profiles, or alternatives such as infrastructure and real estate which have been in the eye of the storm despite the premise of inflation-linked cashflows.
Within equity markets, we have often referenced the divergent performance of the US with the rest of the world. Since the Global Financial Crisis, the US market has outperformed strikingly thanks to a strong domestic economy and resulting confidence of a growing consumer sector, a dynamic capital market environment and a dominant consumer technology sector which has been able to deliver emphatic profits growth while other areas saw anaemic returns.
It remains vitally important to recognise this strength but balance it with other markets and their divergent characteristics. At times, we have adjusted allocations to reflect variations in outlook, whether on a strategic or more cyclical basis. Currently, we believe that the concentration and expensiveness of the small cohort of US mega-cap stocks could be a meaningful source of volatility for markets in the future.
After the UK, the US is still the largest regional allocation in portfolios, but it is smaller than previously, and we have diluted exposure to the biggest stocks with the Xtrackers S&P 500 Equal Weight ETF. An equal weighted ETF invests equally in companies in an index irrespective of their size, and therefore can reduce the risk of investing in an index if you believe its larger companies are overvalued.
Our Outlook
As we look to the second half of the year, there are reasons to be more positive on markets, but as ever, risks remain. As a result, our portfolios are positioned close to their strategic allocations. On the positive side, previous market falls have reset valuations to more attractive levels.
Cash levels are attractive now, but should the inflation backdrop continue to improve, the risk is that holders of cash will soon find they are unable to invest at current market pricing; there is an opportunity cost in sitting on the sidelines.
Bond markets have re-set. Central bankers’ belated resolve against inflation means that yields provide more of a cushion to manage future uncertainty. In the US, there is an expectation that interest rates will soon fall as concerns of a slowdown persist. However, Treasury bonds now offer a higher yield over expected inflation than has been available for a long time. It remains to be seen whether interest rates will peak soon, or plateau at these higher levels, but investors are now being compensated to find out.
US Yields Offer More Protection For Inflation and Rate Uncertainty
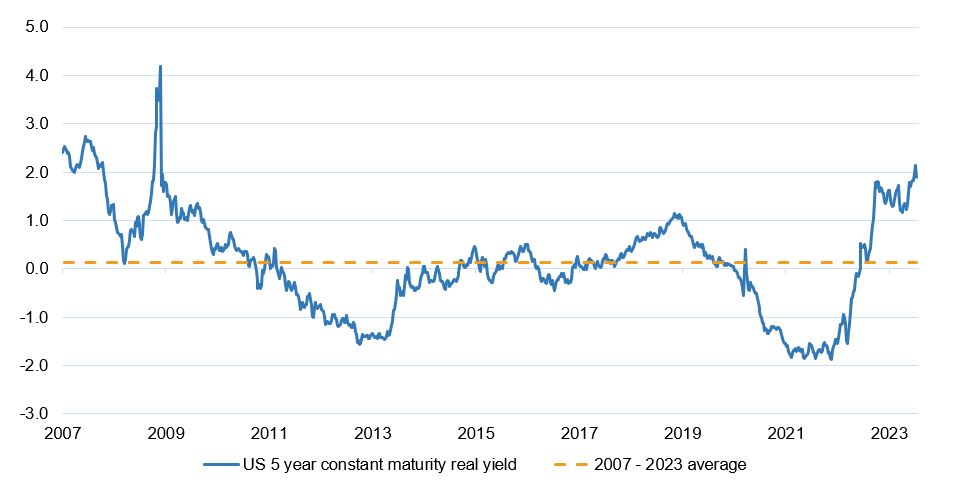
Source: Bloomberg, with Netwealth calculations.
UK bonds have continued to underperform, as market participants expect the Bank of England has more work to do given current second round inflation pressures, as discussed here. We expect that at some point this will create good opportunities for the future.
We are less exposed to credit risk than usual. The all-in yields now available are more attractive than historic levels. However, for multi-asset investors the benefits of incremental gains in yield above government bonds are less important than the way we expect corporate bonds to behave in relation to other asset classes.
Within equities, we are often asked about allocations to the UK market. Ultimately, for a combination of reasons the UK remains attractively priced relative to its history and to other markets. We view the allocation as offering exposure that are very complementary to the dominant US market: attractive valuations in unfashionable sectors with less attractive prospects for sustained earnings growth. Scepticism around domestic economic performance and capital market dynamics signify that international investors are happy to ignore it, meaning that any catalyst to improving sentiment could have a big impact.
Conclusion
It’s clear the past couple of years has been an unusual time for most investment markets, and may have challenged the expectations of investors. It’s also evident that a strategic approach – with low embedded costs, and actively and thoughtfully managing passive instruments – can curtail relative losses in difficult times while also outperforming during more favourable environments.
We work hard to prepare for multiple potential outcomes and to help you meet your long-term financial objectives. To find out more, please get in touch.
Please note, the value of your investments can go down as well as up.

